Copyright © 2002 - Capital Dynamics Sdn Bhd (Co. No. 171744-U). All rights reserved.
i Capital ® and Capital Dynamics ® are registered trademarks of Capital Dynamics Sdn. Bhd.
Established in 1989, the investment advisory arm of Capital Dynamics provides independent, objective and comprehensive advice through i Capital. Published in English and Chinese, it is available in print and via the Internet.
Why i Capital is Different
-
1. A Humble Claim
We do not claim to be 100% accurate. We are certainly not. What i Capital aims to achieve is contained in the following advice:
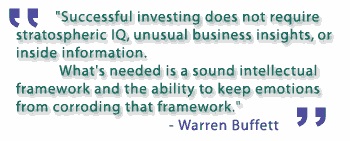
-
2. A Sound Framework
So, instead of pretending that we can be 100% accurate, i Capital provides investors with a sound framework. What is our investing framework? It is built upon very comprehensive analysis.
To arrive at our advice and recommendations, we analyse foreign economies and stock markets, interest and inflation rates, bonds and commodity markets, market psychology, in addition to the local environment. i Capital provides a clear perspective of how markets interact and how this interaction influences your investment. It translates the significance of events and interprets them in terms of the market. We study PE ratios or Return on equity or Wilder's RSI, for example. But we are neither chart fanatics nor pure fundamentalists.
-
3. Read us Anywhere
Since 1989, i Capital has been available in print with the Internet edition available since 2002. Clients get to read our advice anywhere, anytime even when your battery runs out.
-
4. We are Bilingual
Since 1989, i Capital has been providing its investment advice in English and Chinese, the world's two most popular language.
-
5. We Are Naked
Take a look at our current stock ratings. In i Capital, we hide nothing, whether the beautiful or the ugly. The date and market price when a particular stock was first rated is clearly shown. For stocks where we have rated a Buy and a Sell, we have a separate list of such recommendations, which is available for free.
-
6. Appropriate Asset Allocations
i Capital provides asset allocation guidance, a topic that is very often overlooked by investors to their own detriment. Why? No investor has the ability to consistently predict the top and the bottom of the stock market. An appropriate asset allocation recognises this weakness in timing buy and sell decisions. As a result, having the right asset allocation can be an important factor in determining one's investment performance.
-
7. Investing or Trading made simple
i Capital has 4 regular portfolios to suit different investment objectives and time horizons. All the investor or trader has to do is to follow precisely the actions taken by the relevant portfolio. Investing and trading cannot be made simpler.
-
8. Precise Definitions
Precise and consistent definitions of immediate, short, medium and long-term are given and used in i Capital. In fact, the same definitions have been in use since the first issue of i Capital in 1989.
- Capital Dynamics Portfolio
- i Capital Global
- C D Timer
- 2nd Chance
- Eclectic Trader
- Completed Transactions
Capital Dynamics Portfolio
Capital Dynamics Portfolio or Section C was started on 5th September 1991. This portfolio is meant for longer-term investors.
Return(%) | |||
Period | MSCI Malaysia | EMAS | Section C |
Sep - Dec 1991 | 1.51 | -1.57 | 7.41 |
1992 | 11.19 | 15.33 | 15.75 |
1993 | 113.48 | 136.77 | 125.88 |
1994 | -24.86 | -26.08 | -22.21 |
1995 | 3.37 | -1.48 | 14.38 |
1996 | 23.86 | 24.40 | 33.69 |
1997 | -51.62 | -56.51 | -15.55 |
1998 | -5.60 | -2.82 | 3.31 |
1999 | 48.08 | 40.46 | 77.98 |
2000 | -17.25 | -22.59 | -1.91 |
2001 | 2.26 | 3.42 | 10.58 |
2002 | -2.66 | -4.83 | 15.72 |
2003 | 23.12 | 24.37 | 50.57 |
2004 | 11.81 | 9.56 | -1.87 |
2005 | -2.06 | -4.86 | -8.07 |
2006 | 24.25 | - | 74.50 |
2007 | 32.68 | - | 98.16 |
2008 | -40.77 | - | -41.29 |
2009 | 46.25 | - | 28.90 |
2010 | 19.33 | - | 14.65 |
2011 | -0.2 | - | 1.27 |
2012 | 6.84 | - | 11.72 |
2013 | 11.58 | - | 4.47 |
2014 | -7.57 | - | 1.17 |
2015 | -4.73 | - | 9.67 |
2016 | -2.53 | - | 4.47 |
2017 | 9.24 | - | 9.14 |
2018 | -6.99 | - | -8.01 |
2019 | -6.13 | - | -0.79 |
2020 | -1.66 | - | 4.47 |
2021 | -7.27 | - | 26.45 |
2022 | -4.32 | - | -8.05 |
2023 | -3.19 | - | 24.51 |
2024* | 9.33 | - | 11.33 |
Compound Return (% Per Annum)
(Sep 1991 to Oct 2024) |
|
Section C | 13.19 |
MSCI Malaysia | 3.00 |
EMAS | - |
i Capital Global
% Return
1 Jan 2024 to 30 Oct 2024 |
|
Section C2 | 6.68 |
MSCI A | 14.49 |
MSCI Malaysia | 9.33 |
Compound Return (% Per Annum)
Jan 2007 to Oct 2024 |
|
Section C2 | 0.79 |
MSCI A | 4.69 |
MSCI Malaysia | 1.07 |
C D Timer
C D Timer | Return (%) | ||
Period | MSCI Malaysia | EMAS | Section D |
Apr - Dec 1994 | -0.41 | 2.85 | 1.46 |
1995 | 3.37 | -1.48 | 12.93 |
1996 | 23.86 | 24.40 | 47.93 |
1997 | -51.62 | -56.51 | -39.14 |
1998 | -5.6 | -2.82 | 29.65 |
1999 | 48.08 | 40.46 | 56.54 |
2000 | -17.25 | -22.59 | -11.14 |
2001 | 2.26 | 3.42 | 8.54 |
2002 | -2.66 | -4.83 | 3.33 |
2003 | 23.12 | 24.37 | 22.32 |
2004 | 11.81 | 9.56 | 24.40 |
2005 | -2.06 | -4.86 | -1.64 |
2006 | 24.25 | - | 56.54 |
2007 | 32.68 | - | 79.69 |
2008 | -40.77 | - | -22.37 |
2009 | 46.25 | - | 22.93 |
2010 | 19.33 | - | 26.37 |
2011 | -0.2 | - | 7.33 |
2012 | 6.84 | - | 22.09 |
2013 | 11.58 | - | 3.44 |
2014 | -7.57 | - | -0.35 |
2015 | -4.73 | - | 5.39 |
2016 | -2.53 | - | 4.52 |
2017 | 9.24 | - | 11.04 |
2018 | -6.99 | - | -11.40 |
2019 | -6.13 | - | -1.22 |
2020 | -1.66 | - | 0.39 |
2021 | -7.27 | - | 18.58 |
2022 | -4.32 | - | -8.68 |
2023 | -3.19 | - | 28.72 |
2024* | 9.33 | - | 17.09 |
Compound Return (% Per Annum)
(Apr 1994 to Oct 2024) |
|
C D Timer | 11.11 |
MSCI Malaysia | 1.26 |
EMAS | - |
2nd Chance
The 2nd Chance portfolio was only started on December 7th 2000. This unusual portfolio is a result of the brutal honesty and demanding standards that we impose on ourselves. Thisportfolio caters to regaining losses from previous transactions we have previously advised.
Section D2 was set up to assist our subscribers who may have followed our stock selections that have subsequently not worked out. The value of The 2nd Chance Portfolio has reached the original cost of RM80,000 for the second time. The portfolio is now closed. There will be a new "The 2nd Chance Portfolio" set up to help subscribers who may be holding some new dead ducks. The objective is to recover principal. In the subsequent weeks of i Capital, it will select this new batch of dead ducks. Stay tuned.
% RETURN
(End Oct 2014 to Oct 2024) |
|
MSCI Malaysia | -22.13 |
2nd Chance | 27.72 |
EMAS | - |
Compound Return (% Per Annum)
(Oct 2014 to Oct 2024) |
|
2nd Chance | 2.48 |
MSCI Malaysia | -2.47 |
EMAS | - |
Eclectic Trader
Eclectic Trader |
Return (%)
|
||
Period | MSCI Malaysia | EMAS | Section G |
Dec 1993 | 24.85 | 28.10 | 40.82 |
1994 | -24.86 | -26.08 | -6.46 |
1995 | 3.37 | -1.48 | -2.83 |
1996 | 23.86 | 24.40 | 4.75 |
1997 | -51.62 | -56.51 | -22.51 |
1998 | -5.6 | -2.82 | -1.58 |
1999 | 48.08 | 40.46 | 57.10 |
2000 | -17.25 | -22.59 | -27.00 |
2001 | 2.26 | 3.42 | 5.85 |
2002 | -2.66 | -4.83 | 13.28 |
2003 | 23.12 | 24.37 | 32.32 |
2004 | 11.81 | 9.56 | 25.08 |
2005 | -2.06 | -4.86 | -21.26 |
2006 | 24.25 | - | 55.62 |
2007 | 32.68 | - | 36.92 |
2008 | -40.77 | - | -28.58 |
2009 | 46.25 | - | 20.12 |
2010 | 19.33 | - | 14.41 |
2011 | -0.2 | - | 2.07 |
2012 | 6.84 | - | 2.01 |
2013 | 11.58 | - | 1.65 |
2014 | -7.57 | - | 2.70 |
2015 | -4.73 | - | 2.12 |
2016 | -2.53 | - | -1.86 |
2017 | 9.24 | - | 5.12 |
2018 | -6.99 | - | -5.99 |
2019 | -6.13 | - | 19.67 |
2020 | -1.66 | - | 18.69 |
2021 | -7.27 | - | 2.75 |
2022 | -4.32 | - | -13.01 |
2023 | -3.19 | - | 9.75 |
2024* | 9.33 | - | 2.49 |
Compound Return (% Per Annum)
(Dec 1993 to Oct 2024) |
|
Eclectic Trader | 5.90 |
MSCI Malaysia | 1.05 |
EMAS | - |
This is a list of previous recommendations that we have rated a buy AND a sell. In other words, the positionn is closed. In contrast, the list of ratings in any current issue of i Capital is where a sell rating has not been issued yet and the position is still open.
There is a list of over 150 completed transactions including those in the SGX and HKSE stock markets.
To view a list of Completed Transactions, you can download a PDF file containing all the latest data.
We believe that successful investing involves 3 "i"s - Independence, Intelligence and Integrity. Why? Here are the reasons why investors often perform poorly or fail to achieve consistent success from their investments in the stock market.
Independence
Capital Dynamics is an independent fund management and investment advisory house. We are not affiliated with any financial institution, stock broking companies, political or government organisation, preventing any possible conflicts of interest from arising. |
Intelligence
Capital Dynamics does not act on tips, rumours, and hearsay, but only an intimate knowledge of investments, based on intelligent and objective analysis. Our research is independent and we have our in-house team of professionals to analyse companies, industries, markets and economies first-hand. |
Integrity
While it sounds abstract, Capital Dynamics believes that integrity will in the long run show in the investment returns our clients receive. Without integrity, independence and intelligence have no meaning. |